Assignment Four: Hackathon
This week was Hackathon week and each group was challenged to use any past data and recreate the information into visually-pleasing charts and graphs in less than 24 hours.
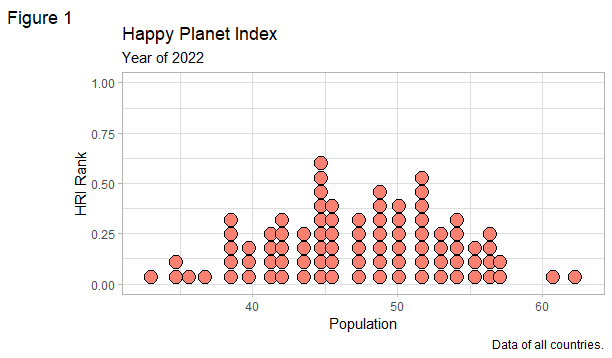
My team decided on revisiting the “Happy Planet Index” data.
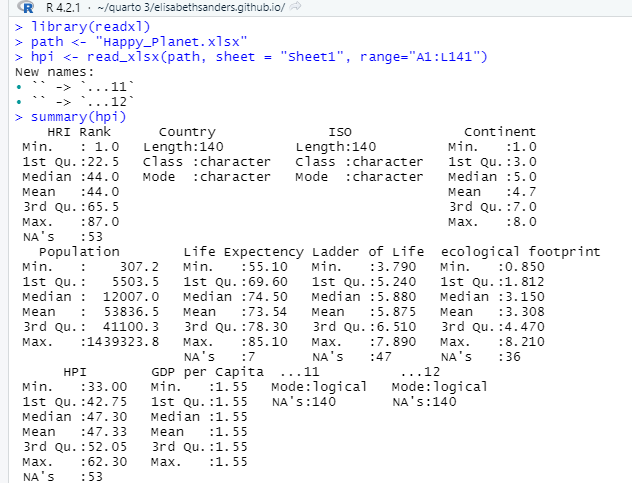
After inputting library(tidyverse) then having the program to analyze the HPI data, we got a summary that looked like this:
After setting up the original charts with these codes:
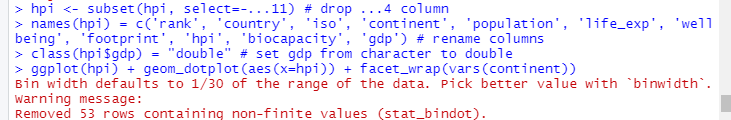
initial charts:
We were able to create these charts:

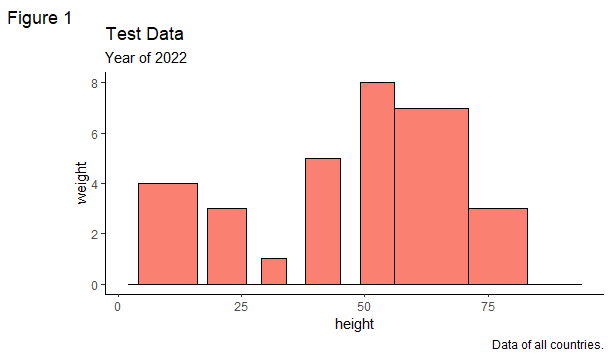
Testing Data
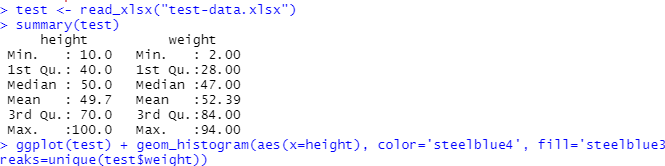
This is a basic histogram we were able to create

Then by changing the theme() function:

We got the initial chart to look like:
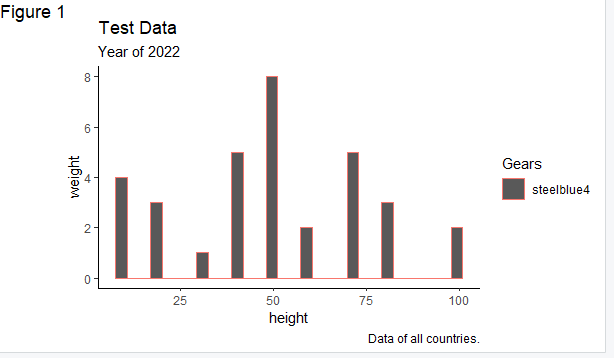
Which we did not like aesthetically. After changing a few things,
-02.png)
We were able to all agree on this chart as the final product:
changed themes
theme_classic
theme_drawline
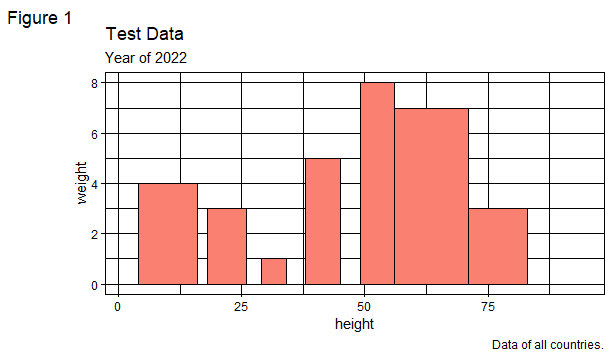
theme_light

Using the same methods for the dotted chart we created before:
-01.png)
-03.png)
We created the theme_element:
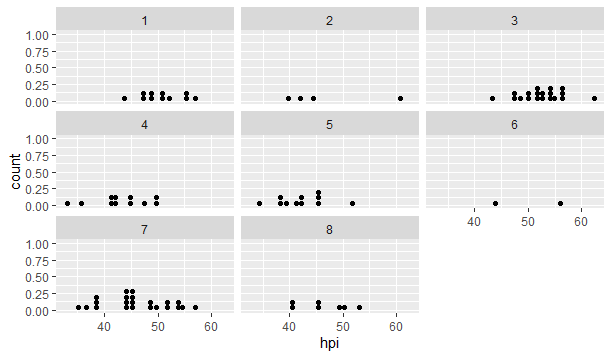
ultimate result:
To result to theme_light along with theme_element: