Assignment Two: Paul Murrell’s R Graphics
For our second assignment, we were asked to run a program by Paul Murrell in which showcases his research by means of charts and graphs. The information, without the functions being ran line by line, is shown below.
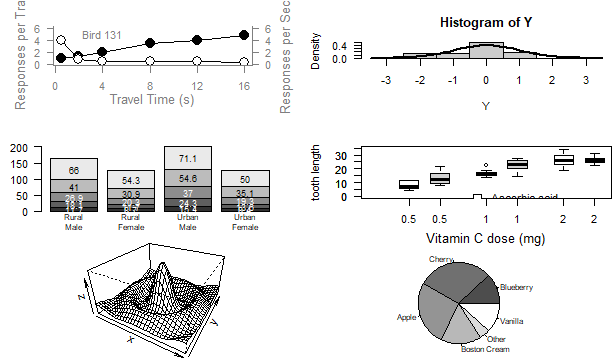
However, if you run the function line-by-line, here are the results:

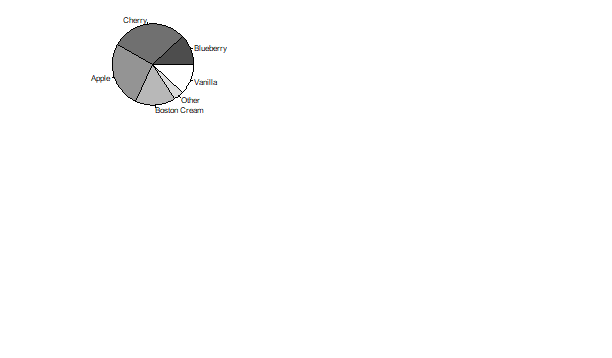
What’s the difference?
It seems as though there were details and an entire chart missing in comparison to running the entire function at once.
Happy Planet Index
To practice how to use functions and how to plot them, we will use the data given by Happy Planet Index. The data is found on our class’ github page as well as on the website http://happyplanetindex.org.
for the par () function: